I know this will shock some of you – but a lot people don’t have Global Entry.
Yes. Sit back. There. I’ve said it. People travel into the United States of America without Global Entry to speed their way through.
And for those of us who don’t (your coffee maker extraordinaire included), that means queuing up and waiting to be stamped into the United States.
And at some airports that can be a real challenge (such as Chicago O’Hare for example which can be 15 minutes if you’re lucky, or the full 1 hour and 30 minutes if you’re stuck in queues. And believe me, I have done the full 1 hour 30, pondering the meaning of life, the universe and everywhere in-between).
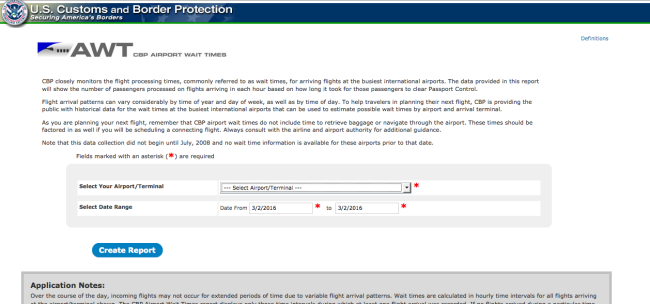
Thankfully, there’s a useful site that might be useful for predicting you wait times, and it’s provided by US Customs and Border Patrol – it’s Airport Wait Times http://awt.cbp.gov/
According to the US Customs and Border Patrol:
The data provided in this report will show the number of passengers processed on flights arriving in each hour based on how long it took for those passengers to clear Passport Control.
We all know that arrival patterns can change by time year, day week or even day with peaks and troughs. So the US Customs and Border Patrol has released the historical data.
The times only include clearance to passport control. It does not include luggage handling times or navigating through the airport.
The data is from July 2008 (when this data was first collected).
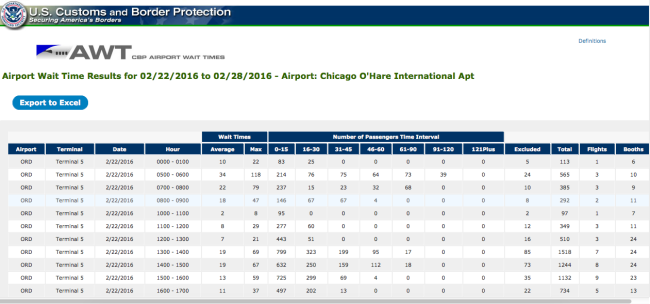
So how does it come out? I’ve selected Chicago O’Hare as an example, and I want to look at last week’s data (22/02/16-28/02/16):

CBP Airport Wait Times – data http://awt.cbp.gov/
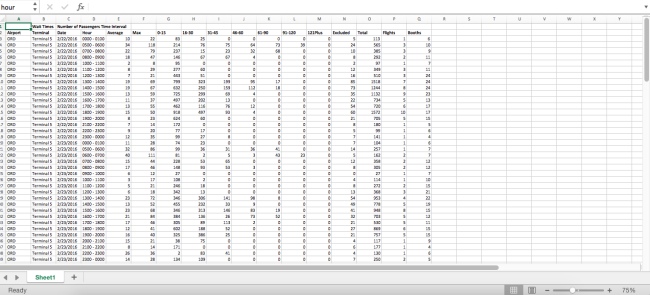
Well, that’s a bunch of data that can be difficult to digest. Thankfully, there’s an “Export to Excel” to help you make sense of it. Here’s the data in Excel:

CBP Airport Wait Times – data http://awt.cbp.gov/
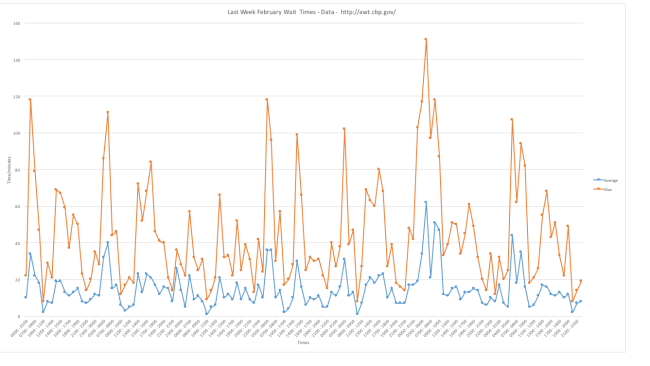
And with a few clicks… you can start to make sense of the information:

CBP Airport Wait Times – data http://awt.cbp.gov/
So we can see with the blue and orange lines the wait times – the blue line being the “average” wait time, with the orange line being the maximum wait time, with Fridays very much a nasty peak point at Chicago O’Hare T5 (62 minutes average wait time, 151 minutes maximum on 27th Feb at 06:00-07:00).
As you can see, once you put the data in a chart, it’s a lot easier to visualise and understand
The data covers a fair few US Airports – notably, it does not cover Pre-Clearance points (such as Toronto, Dublin, Vancouver etc). Smaller airports may not be on the list.
Still, for those of us who are waiting in queues to be seen to by US Customs and Border Patrol, this could be a useful tool for picking out times to arrive at airports on a plane… and when to fly into an airport and bring a bottle of water with you whilst you wait to be seen…
Welcome to Economy Class and Beyond – Your no-nonsense guide to network news, honest reviews, with in-depth coverage, unique research as well as the humour and madness as I only know how to deliver.
Follow me on Twitter at @EconomyBeyond for the latest updates! You can also follow me on Instagram too!
Also remember that as well as being part of BoardingArea, we’re also part of BoardingArea.eu, delivering frequent flyer news, miles and points to European readers
